Anatomy of a Protest: Activism, Social Media and Urban Space
Design Computation Thesis completed By Alireza Karduni – 2017
Activism is a complex phenomenon. Indeed in the current atmosphere and with the prevalence of information technology, activism happens across many different layers. But has techonology transformed the way we demand justice? in the case of the Charlotte protests, we learned from our focus group studies that social media and information technology played a crucial role in bringing people to the public space. Our interviewees gave us a narrative about which places in the city were used and a rationale for why those places were important. Many of these places were identified as being important due to their strategic location, better accessibility and their proximity to many economic activities in the city.
Our interviewees all used social media of different types to diffuse information, to contact friends and organize and plan future events. However, every social media is used differently. Text messaging is used to virtually connect with friends and acquaintances. Encrypted messaging is used to communicate without the fear of being monitored. Some social media such as Facebook has features such as Events and chat group which enables better organization for future events. Some social media such as instagram and snapchat are multimedia focused and they are used to share images and videos of protests as they happen. Live streaming plays a crucial role in motivating people by offering the most realistic snapshot of a protest. Twitter, which is the most public but with the most restrictions, offers a platform for people to communicate with a large audience in a streamlined manner. News, arguing and some spatial organization are some usages of this form of social media.
While we recognize that different social media have different functions, we analyzed Twitter mostly due to the wide availability of the data and to get a better understanding of the dynamics of social media in the context of Black Lives Matter protests. The rich unstructured nature of social media data offers many challenges but enables us to learn greatly about how people interact in social media.
Analyzing the timestamp of tweets in the Charlotte protest shows us that Twitter responds rapidly to the events of a protest. This feature makes Twitter a very powerful tool for mobilizing and discussing protests as they happen. Even though Twitter allows users to geolocate their tweets, the public nature of the platform does not invite many people to enable this feature. Most of the spatial organization using Twitter happens through text, images, and videos.
By analyzing the text of tweets, we were able to extract location information. Many tweets do not include spatial information, however, by studying the frequency of how each specific place in Charlotte was mentioned, we were able to show that the most important places in the protests identified by our interviewees are also reflected in people’s tweet. This information brings us to the point that Twitter is not used uniformly by everyone.
To go further in depth into this point, we analyze our dataset of 1.3 million tweets through the lens of social networks. our social network analysis shed light to many interesting and important features about the usages of social media. Community detection allowed us to see that users interact mostly with individuals with similar stances to protests. Our dataset was categorized into two major communities. One community very supportive of the Black Lives Matters protests in Charlotte and one critical.
These two communities treat spatial information differently. Our social network shows that people that use spatial information in their text are mostly connected with the community that has mostly supporters of Black Lives Matters as its most influential nodes. We also observed that most of the people who use detailed spatial information are Charlotte locals. This hints us to the fact that people have different interests regarding the Black Lives Matters protests. Individuals who are against the movement mostly criticize the demands and the actions of the
protesters. On the other hands, people who are supporters of the protests, diffuse information about the detail protest places to mobilize and influence people to attend more.
Finally we can observe that the top influencers in our social network include many News agency and journalism related users, as well as politicians and professionals activists. This can again, hints us to the fact that different social media have different functions, and the public nature of Twitter allows for more news related and on the ground information, and other media might have better capabilities in organizing future events. In the future, in order to have better understanding
[Kak-tos]: A tool for optimizing conceptual mass design and orientation for rain water harvesting facades
By Ashley Damiano, Chris Beorkrem, and Jefferson Ellinger- Presented at the Design Modeling Symposium- Paris 2017
Link to full paper
The tool outlined here works by importing the weather data for a given location from the National Oceanic and Atmospheric Administration (in our initial studies we used a five-year window). This data is first simplified to include only days where measurable rainfall occurred. The data is then further stripped to only include the measurement of precipitation, wind direction and velocity, presuming a median rain drop size. The tool functions by projecting rays onto the building mass following the angle calculated that the WDR would fall during that given day, and calculates how much of the WDR would hit each of the sides of the mass.
Based on these calculations the tool can then provide a total annual calculation for WDR on each facade or can rotate the mass based on a user specification to test for the optimal orientation of the given shape. Predictably, the optimal orientation being that in which the greatest surface area of the mass is facing the median windward direction on rainy days, which will allow the most amount of WDR to hit the largest surface area. The user can specify the amount of variation in the rotations to determine how computationally intensive the testing is.
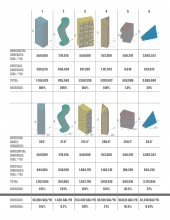
As seen in Table 1, both form and orientation play significant roles in the amount of WDR that hits each facade. By adding the facades of the mass into the calculations for rainwater harvesting, the percentage of WDR that interacts with the form at least doubles for each instance, except for forms 5 and 6 – both of which contain larger horizontal surfaces and shorter facades than forms 1-4. The increase in WDR on the facades through optimal orientation on the site differs for each form. Re-orienting forms 1 and 3 from their original test position once again doubles the amount of WDR on the facades, whereas re-orienting forms 2 and 6 has minimal effect on the amount of WDR. The intent of this tool is to aid designers in massing and orientation studies. Using Revit’s conceptual mass tool allows designers to study iterations quickly, analyze them using Kaktos, and make changes accordingly.
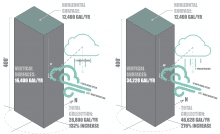
Lastly, the tool can be used to calculate the optimal locations for rainwater collection to minimize the frequency of large quantities flowing along the surface of the building. This aspect of the tool works by tracing the gravitational flow of the water along the facade using a sphere-mapping method (Beorkrem 2013). Sphere-mapping uses a technique of intersecting spheres with a complex mass to find the approximate circular shaped intersection between the mass and the sphere. The shortest line between the center of the sphere and this circular intersection represents the likely path for the water. Using the endpoint of the shortest line, another sphere is placed and this process continues iteratively while a total water amount is tallied to indicate when a total reaches a user defined amount at which point the water can be collected. Placing intermediate collection points on the facade of a building removes the water before it reaches the ground, reducing the amount of urban runoff and preventing the unnecessary use of energy to pump the water back up through the building.

Invisible People; An Urban Responsive Digital Interface
By Noushin Radnia, Spring 2017 StudioLab
INVISIBLE PEOPLE is a social awareness project that gives everyone an ability to envision and engage with the community they live, in order to empower the larger society around them.
An access to an open resource for communication. The story is the most important unit of social change and the internet is becoming as a zone for engagement. This vision has emerged from ideas around building platforms for engagement around community to become something wider, which this proposal is seeking to hone and explore. The emergence of urban social media(digital public space) with contribution of citizens.
This project presents Invisible People; a social awareness project that gives its users an ability to engage with the community they live in. It targets to improve the connectivity between people experiencing homelessness -the most vulnerable citizens as the users of the public space- and the rest of the society. Invisible People provides a crowdsourcing platform for communication that aims to empower the society. In particular, it utilizes a responsive digital interface that broadcasts stories put into the system by the homeless population in designated public spaces. Moreover, it is an example of how the use of IoT creates a qualitatively different urban sociality. Personal stories are integral units of social awareness that catalyzes this system and encourages empathy and community engagement through innovative and artistic ways. The smart system presented in this article aims to integrate the audience feedback and help as an input to complete the flow by connecting two distant populations.
Invisible People is seeking to highlight its manifesto by synthesizing Awareness, Communication, and Engagement. The design considers a bottom-up approach by considering the city as a social media and promoting the citizens responsibility, which resembles an exercise of the right to the city.
Urban Activity Explorer, a Visual analytic interface for Social Media
Data and Design: Using Knowledge Generation/Visual Analytic Paradigms to Understand Mobile Social Media in Urban Design
As smart phones have become part of everyday life, communication technology and its role in shaping cities and social life became an essential topical area in architecture and urban design. The enormous volume of data being generated (estimated to reach 438 billion messages per day in 2019) [Ericcson 2016, Arce 2015] now provides new information about the social realities of cities. This development has expanded research and teaching the areas of visual analytics, urban modeling, and communication studies [Chang 2007, Offenhuber 2014, Waddel 2002], which have become important resources in environmental design disciplines. Our work expands upon this discourse, addressing the intersection of the built environment and virtual communication.
Mobile social media (Twitter, Four Square, Instagram, etc. with mobile devices such as tablets and smart phones) plays a particular role in our research as it combines many important geospatial, temporal and semantic elements as a data source. These elements have been considered important in conducting geospatial analysis [Andrienko 2010]. Twitter’s online social networking service is particularly interesting both for its widespread use and the API (Application Programmer Interface) that allows access to data for software development and research purposes [gnip 2016]. Twitter is also well studied (for a ten year old service) and has been used toward understanding a variety of urban scale phenomenon from locations of traffic accidents or other emergencies and unplanned events such as Tahrir Square, to understanding spatial movement of food trucks [MacEachren 2011, Tufekci 2012, Wessel 2015]. We recognize the limits of Twitter data; it can be demographically skewed toward the younger and the wealthier, and it is only reliable in large, aggregated data sets. Our results are subject to verification by other sources, but the methods would remain applicable.
Our interest in mobile social media investigates the relationship between the flow of information generated by mobile social media and the urban form of the city. One extreme position suggests information and communication technologies (ICT) have rendered location meaningless; such a position was taken by Melvin Webber [Webber 1964] as early as the 1960’s based on his analysis of the extreme sprawl of American cities such as Los Angeles. At the other extreme are theorists who believe that the essential character of cities has remained more or less unchanged; new urbanism [Leccese 2000] is the latest such belief in the “timelessness” of urban form.
We have tried to make both positions sound credible, but both the rearguard and the avant-garde ignore current urban conditions in favor of longing for the past or promoting a bright future of uncertain prospect. Our effort is focused on finding specific on-going evidence of ICT as an indicator of the spatial form in the city, and conversely how the form of the city influences the uses of ICT. Mobile social media data is an ideal empirical source for such an analysis, combining spatial, temporal and topical information and providing large data sets for analysis. It is important (and difficult) because it is unstructured data, mostly unfiltered by existing categorization.
In this paper, we present three models of how to approach the analysis and use of Twitter data. The first two began as focused attempts to accumulate and explore large-scale Twitter data. The third is a model that incorporates lessons learned from the first two models into a novel visual analytic interface. Our research team includes professors, researchers and advanced students from architecture, urban design, computer science and visualization.
First Approach: Problem Formation and Selective Data Acquisition
We began by collecting data using the Twitter API, which allows anyone to collect tweets by incorporating a number of delimiting variables such as time, location, hashtag, etc. Using this method, approximately 10,000 tweets were collected. We formulated specific problems with an important spatial component that Twitter data might help us to understand, gathering information that was either geographically limited or constrained by a keyword. This avoided a potential flaw with Twitter data; only about 2% was geo-tagged by the user. The use of a tightly defined search captures a selection of all users in that area.
Two examples will illustrate this approach.
We guessed that the spatial and temporal pattern of tweets during travel might vary from everyday patterns. Based on the collection of geolocated tweets at an international airport over a two-week period, we were able to generate heat maps of the tweet locations within the airport. This was a fairly predictable pattern highlighting the concourses, where people have free time as they wait, in addition to last minute or just arriving tweets on the taxiway.
We were then able to identify individual users (without breaching their privacy) and their tweet history of a two- week period centered on their tweets at the airport. We generated a graph that compared the frequency of their tweets in the airport versus the frequency of their tweets on the days before and after the airport sample. We found a clear pattern of accelerated tweets during their time at the airport, shown in the radial graph by the large size of the red graph area (Figure 1).
A second example project studied tweet activity associated with the work of Banksy, an artist who creates artwork in public places with no prior warning. His work has a devoted following, and a great deal of excitement attends with possibility of his new artwork emerging.
To gather information about Banksy, we again used the Twitter public API, limiting the search to geolocated tweets that use the keyword Banksy. We were able to gather a large number of tweets and study the blooming of tweets volume following the arrival of the new artwork and the spread of the tweets around Bristol and across England.
Using visualization, we were able understand how a spontaneous event has not just a time signature (which has been extensively studied) but also a pattern of spatial diffusion from Bristol outward (largely toward London) (Figure 2).
Based on our work, we identified both strengths and weaknesses to this problem formulation approach. It allowed us to focus our inquiry and deal with the limits of the public API (limits to the number of tweets we can receive by a query and the number of times we can query the Twitter database). At the same time, the specificity of our search forestalled any wider exploration of large data sets without a heavy load of assumption.
Second Approach: Large Scale Data and Selective Query
In the spring of 2016, we joined a campus-wide Data Science Initiative, which afforded us access to large archives of Twitter data not accessible from the public API. We acquired a collection of about 2 million tweets of New York City and an equal number of Los Angeles metropolitan area over a two-month period. Unlike our previous use of the Twitter public API which used specific keywords to search, we used a large geographic boundary to get access to a comprehensive set of geolocated tweets for those two cities. Our datasets consisted of only the tweets that originated from the specified geographic boundaries. Our goal was to create a permanent archive that we could use for the study of a variety of issues.
Our aim was to introduce data visualization and analytics to analyze social media data for the purposes of urban studies. One research group focused on the locations of the tweet data relative to morphological and spatial characteristics of the city and the other focused on social characteristics of using the locational, temporal and topical dimensions of the data.
For each group, we used the Twitter data in combination with a variety of data analysis methods such as Python programming for data wrangling and analysis, Geographic Information Systems (GIS) for mapping and spatial analysis of the data, MongoDB database for accessing and querying the data.
The urban form and information study investigated the distribution of geolocated tweets and their relationship to other normative factors in urban analysis. The goal of this group was to study and analyze elements of urban form and policy and their relationship with tweet data; for example focusing on the analysis of transit oriented development (TOD) areas in Los Angeles or the connectivity of streets.
We started by creating a map of the locations of each tweet (1,000,000 total) in Los Angeles County and New York City. We then proceeded to develop a map that represented a cumulative tweet count for each census track within the county, with a single dot sized to represent the total count for each track. Next, we overlaid the census tract tweet count index with population, age and ethnicity data derived from American Community Survey 2014 [Bureau 2016]:
In addition to the visual evidence provided by these overlaid maps, we also used linear regression analysis to find relationships between different variables. The results of this analysis showed no significant correlation between any of the factors obtained from the U.S. Census. The results of these regression analyses showed us that the locations of geolocated tweets were not directly and linearly affected by population demographic information.
We suspected that land use might be a more important predictor of tweet location than demographic data. We derived land use and zoning data from each city’s respective planning governments [Planning 2016] and mapped the tweet data against different land use types (Figure 3):
- Residential density
- Institutional density
- Mixed use zoning
- Parks and open space
- Commercial development We performed a regression analysis on these findings to determine the correlation between these factors. The only clear correlation was between commercial development and tweet density. We were also interested in the relationship between mass transit and tweet density. We located each Metro station in Los Angeles and every subway station in lower Manhattan, measuring the tweet density at each within a one- mile radius. We discovered influence on tweet activity but it was not decisive. We also calculated tweet density for 1 mile, .5 mile and .25 mile radius from each station to try to test the influence of the station on the tweet activity. We found both a general rise in tweet activity surrounding stations and a significant number of anomalies. Finally, we were interested in analyzing and visualizing the movement of Twitter users. Our first attempt connected the locations of every user who tweeted more than two times as a straight line. However, due to the nature and scale of the dataset, this type of visualization created an unusable spaghetti like map identified by other researchers [von landesberger 2016]. To solve the issue, we developed a unique method that identified Twitter users with multiple tweets over a day and plotted their locations onto the street map using Dijkstra’s shortest path algorithm [Dijstra 1959]. To calculate the shortest path we used ArcGIS Network Analyst [esri 2016]. We collected the street data from OpenStreetMaps [OpenStreetMaps 2016] and processed our network files with GISF2E [Karduni 2016] to develop a representation of the use of the street system. We found considerable asymmetry of the Twitter users on the street grid using on the already identified location of commercial activity. The urban form and society study tackled a much more complex problem. They studied how urban space is related to social factors, including both the identification of preferred locations for groups of tweets and sub groups. This group began with an analysis of the demographic factors including population density, race, language, age, income and gender. Each of these factors were analyzed using ordinary least square regressions and displayed in a scatter plot matrix. No significant correlation was found between any of these factors and the location of tweets. We next turned our attention to a comparison of English and Spanish language tweets. We compared the distribution of geolocated tweets with Hispanic information from the U.S. Census. We also studied the distribution of English and Spanish language tweets over the period of a month, identifying the top five spikes by location in each language. Seeking to discover the relationship between events and tweet data, we identified major events from archives of the Los Angeles Times newspaper for a one-month period. For each event, we identified the volume of tweets and plotted geolocation information. Using the Dijkstra’s shortest path algorithm mentioned above, we constructed tweet trails for all English and Spanish language tweets. We were then able to compare the similarities and differences of movement between the two groups (Figure 4). We were then able to construct heat maps highlighting the concentration of each group’s movement that showed areas where different groups of people tweeting in different languages were frequently traveling. While our studies yielded interesting insights into the use of social media, the amount of special knowledge and the effort entailed by this approach limited its general adoption and the ability to use it in design settings for rapid feedback and scenario testing. Third Approach: Interactive Visual Analytics and Large Data Sets Based on the limits that we identified using selective queries, we partnered with a visualization group on campus to design a visual analytic interface using New York City and Los Angeles data sets.
Visual analytics is the emerging field of analytical reasoning facilitated by interactive visual interfaces. The field’s important features include the ability to deal with high-dimensional data sets, to present information visually, and to allow researchers to interact with this information. Visual analytics’ fundamental premise is that analysis is better undertaken as a symbiosis of the computational power of computers with the pattern and sense-making capacity of human users [Ribarsky 1994, Chen 2009].
In this phase, we created Urban Activity Explorer, a new visual analytic interface, initially using the 2 million tweets we have collected in Los Angeles County as a sample data set.
A central and unique feature of Urban Activity Explorer is the map views that afford interactive exploration of the geolocations of the tweet data set. One view includes a heat map showing the intensity of tweets that allows the identification of clusters of activity. A second view includes a flow map, which identifies the paths of all individuals in the data set that have multiple tweets for a single day. Built upon the results of our second approach, we mapped these multiple locations onto the street grid, which provided a view that in the aggregate represents the flow of tweets mapped onto the urban infrastructure. The power of visual analytic interfaces is largely derived from the connection between data representation. In our case, we connect the map views to two forms of topic representation and two forms of timelines.
One topic view includes a simple word cloud (a count of the frequency of the occurrence of a word within a body of text). This view provides a quick overview of topical concerns, especially as the size of the text archive is smaller. The other view includes a topic model in Latent Dirichet Allocation (LDA) [Hoffman 2010] that uses a more complex analysis of the distribution of connections between terms. LDA is more useful with large archives, especially when they may have more complex information.
The first timeline illustrates a simple graph of occurrences of any selected item over time. The user can select any time period to investigate peaks and valleys of tweets. The second timeline accompanies the flow analysis and allows users to simultaneously select both a time interval and a limit for travel distances.
Interaction is a key aspect of our interface that was designed to allow for free investigation of a very large data set, rather than providing answers to one specific question. This allows a diverse range of users to investigate the data the without knowing ahead of time what factors might be important or what they might find. This ability to generate insight and knowledge-building is a key aspect of visual analytic interfaces [Chang 2009].
Figure 4. Urban Activity Explorer, a visual analytic interface showing Los Angeles County. Heat map of tweets location (top left), flow map (top right), word cloud, timelines and language/topic views (bottom).
FUTURE WORK AND CONCLUSIONS
We expect that the next research initiatives within our group will include the explicit incorporation of knowledge generation and user testing our interface with urban design.
Insight and knowledge are key aspects of visual analytic systems. We plan to incorporate the knowledge generation paradigm research of Daniel Keim into our work with Urban Activity Explorer, but more generally we propose such systems as a particularly useful and appropriate approach for design. Keim articulates three levels of reasoning that form a framework for human computation. An important feature of these “loops” is that they represent not steps in a linear sequence, but rather three activity loops with distinct goals and processes that are engaged iteratively. The exploration loop is the exploration of a large data set to test preliminary ideas about the organization of the data. The verification loop is the creation of a hypothesis that is testable within the world of the visual analytic system. The knowledge generation loop tests and extends the interpretative power of a hypothesis.
Once we have completed the incorporation of this knowledge generation approach, we will conduct user tests of urban designers using the framework proposed by Schön [Schön, 1983], which we understand broadly as the proposal of alternatives and an ability to use sensemaking for framing and evaluation. Such a process requires several features that our approach affords to users.
First, any system that will be useful for urban design must be able to provide quick feedback; the quicker the better. This is particularly important for the evaluation process, as probing the design space of solutions is most effective if it can move quickly through widely spaced alternatives. Our approach has moved toward rapid, speculative interrogation of data sets, enabling this quick access and evaluation of alternatives.
Second, a system should allow the discovery of knowledge built up from an iterative search. Visual analytics allows us to “…analyze huge information spaces in order to support complex decision making and data exploration. Humans play a central role in generating knowledge from the snippets of evidence…” [Sacha 2014]. Our approach integrates evidence emerging from the exploration of large data sets with the knowledge and insight of urban designers.
Our interface offers two primary means of accomplishing these objectives. First, it provides a valuable tool to teach principles and techniques of information visualization about cities that are both qualitative (tweet topics) and quantitative (temporal information and counts). Second, the interface allows users to generate new interpretations and insights about cities and human activity that were previously indiscernible with traditional mapping techniques or unilateral data. Therefore, the interface will be used as a methodological tool to develop multi-faceted knowledge in the emerging domain of digital urbanism.
The goal of our research is to discover and invent methods to understand the transformational impact of information and communication technologies. We focus on mobile social media, specifically Twitter, because of its combination of temporal, spatial and topical information.
Over three years in our research group, we began with spatially constrained, modestly sized data sets, progressed to large scale data sets combined with custom scripted queries and finally to the design of a visual analytic interface that will be used as a framework for urban design.
The integration of Urban Activity Explorer, a sophisticated, large-scale visual analytic system into the design process is a novel approach within the fields of architecture and urban design. It provides unique opportunities to leverage our domain knowledge in a way that avoids simplistic solutions, instead incorporating the exploration of innovative approaches using empirical methods. Based on our studies, we have concluded that visual analytic interfaces that create a mixed human computer settings are best suited to unstructured data (such as social media data), design settings and indeed, in open exploration of any data without predetermined and limited objective functions.
Early versions of Urban Activity Explorer were designed using needs surveys and user studies of urban designers. We have now incorporated the knowledge generation paradigm into our ongoing studies with urban designers; this requires refining both the computer interface and the expectations and setting for the users. Our approach has proven to be consistent with the needs of designers for exploration of design alternatives and multiple scenarios; indeed it is in many ways remarkably similar to traditional design methodology, albeit applied to very large data sets. Data is essentially no different than other design factors; it requires interactive engagement and exploration.
REFERENCES
Andrienko, G., et al., Space, time and visual analytics. International Journal of Geographical Information Science, 2010. 24(10): p. 1577-1600. Arce, N. 438 Billion: Daily Volume Of Mobile And Online Messages By 2019. TechTimes 2015; Available from: http://www.techtimes.com/articles/67352/20150709/438-billion-daily-volume-of-mobile-and-online-messages-by- 2019.htm.Bureau, U.S.C., Data Releases. 2016.
Chang, R., et al.,Defining insight for visual analytics. IEEE Computer Graphics and Applications, 2009. 29(2): p. 14-
Chang, R., et al.,Legible cities: Focus-dependent multi-resolution visualization of urban relationships. IEEE transactions on visualization and computer graphics, 2007. 13(6): p. 1169-1175.
Chen, M., et al.,Data, information, and knowledge in visualization. IEEE Computer Graphics and Applications, 2009. 29(1): p. 12-19. Dijkstra, E.W., A note on two problems in connexion with graphs. Numerische mathematik, 1959. 1(1): p. 269-271.
Erricson, Ericsson Mobility Report. 2016. esri.com. Route analysis. 2016; Available from: http://desktop.arcgis.com/en/arcmap/latest/extensions/network- analyst/route.htm. gnip. Gnip -About. 2016; Available from: https://gnip.com/about/.
Hoffman, M., F.R. Bach, and D.M. Blei.Online learning for latent dirichlet allocation. in advances in neural information processing systems. 2010.
Karduni, A., A. Kermanshah, and S. Derrible,A protocol to convert spatial polyline data to network formats and applications to world urban road networks. Scientific data, 2016. 3.
Leccese, M. and K. McCormick,Charter of the new urbanism. 2000: McGraw-Hill Professional. MacEachren, A.M., et al. Senseplace2: Geotwitter analytics support for situational awareness.in Visual Analytics Science and Technology (VAST), 2011 IEEE Conference on. 2011. IEEE. Offenhuber, D. and C. Ratti, Decoding the city: Urbanism in the age of big data. 2014: Birkhäuser. OpenStreetMaps. About OpenStreetMaps. 2016; Available from: https://www.openstreetmap.org/about. Planning, D.o.R., Maps & GIS | DRP. 2016.
Ribarsky, W. and J.D. Foley,Next-generation data visualization tools. 1994. Sacha, D., et al., Knowledge generation model for visual analytics. IEEE transactions on visualization and computer graphics, 2014. 20(12): p. 1604-1613. Schön, D.A., The reflective practitioner: How professionals think in action. Vol. 5126. 1983: Basic books.
Tufekci, Z. and C. Wilson,Social media and the decision to participate in political protest: Observations from Tahrir Square. Journal of Communication, 2012. 62(2): p. 363-379.
von Landesberger, T., et al.,Mobilitygraphs: Visual analysis of mass mobility dynamics via spatio-temporal graphs and clustering. IEEE transactions on visualization and computer graphics, 2016. 22(1): p. 11-20.
Waddell, P.,UrbanSim: Modeling urban development for land use, transportation, and environmental planning. Journal of the American Planning Association, 2002. 68(3): p. 297-314. Webber, M.M., The urban place and the nonplace urban realm. 1964. Wessel, G., C. Ziemkiewicz, and E. Sauda, Revaluating urban space through tweets: An analysis of Twitter-based mobile food vendors and online communication. New Media & Society, 2015: p. 1461444814567987.
“User Agreement” – Five movements in a prepared music field
“User Agreement”
for soprano and chamber ensemble
five movements in a prepared music field
- music composed by Ian Dicke
- Scott Christian, percussion; Mira Frisch, cello; Lindsay Kesselman, soprano; Jessica Lindsey, clarinet; Jenny Topilow, violin
- World Premiere, Monday, 21 August 2017, 5:30 pm
- Bechtler Museum, Charlotte
- Digital Arts Center, College of Arts + Architecture, UNC Charlotte
http://ejsauda.wixsite.com/prepared-music-field
The College of Arts + Architecture at UNC Charlotte is proud to announce an original composition by composer Ian Dicke for performances in a prepared music field as part of an on-going collaboration between Scott Christian of Fresh Ink and the Digital Arts Center at UNC Charlotte. The world premiere will be at the Bechtler Art Museum in Charlotte.
Our collaboration focuses on responsive architecture, an emerging concept that embraces the interweaving of space and digital media as a critical element in contemporary architectural practice and expanded musical performance venues that provide an engaging, inclusive and unique atmosphere for both performers and audience.
We have created a prepared music field that will allow the audience to move through the space using their smart phones to engage both with live performers and digitally delivered augmented pieces of the composition. Each member of the audience will have a unique listening experience depending upon their position and movement during the performance.
The spatial setting informs the prepared music field both through the diffuse spacing of the musicians and by the configuration of performances in multiple settings using topological instruction. The movement through the space affords a new method of spatial engagement for the audience.
The historical constellation of music engages the prepared music field by developing the range of instrumental, found, and manufactured sounds as media for the piece. This project fits within a tradition of innovation and inclusion that stretches back at least a century.
The technological matrix provides a new medium of engagement with the prepared music field through the use of smart phone technology to provide precise location information and to supplement or alter the live acoustics. This project uses technology to actively prepare and interact with the space.

Augmented Reality- HoloLens
By Eric Sauda and Alireza Karduni
Research has been conducted on augmented reality (AR) for several decades. Early work by Azuma helped defined the field [1], and more recent research by Bolter and Barfield has investigated strategies for engaging users[2, 3]. Recent advances in head mounted hardware and software by Microsoft and Google have poised AR for widespread use.
In architectural design, AR is of particular interest because it is inherently spatial and can lead to an understanding of architecture as an interface, marrying space and information. The release of development versions of Microsoft Hololens has provided us with the opportunity to study how AR may intersect with the architectural setting, which we call the architecture interface.
There is a strong inclination within computer science to view AR as a technology that can adapt to existing spatial settings; technology is developed and dropped into an architectural setting. However, designing AR applications and architectural settings together will allow for exploration of a full range of affordances, feedback mechanism and output/display options, leading to generalized set of usability heuristics for AR. It can become one example of Dourish’s call for embodied interaction[4].
We chose to design for a setting that would present considerable spatial and architectural challenges as well as AR challenges centering on access to large amounts of data. The architectural brief was the Mount Zion Archaeological Park in Jerusalem that has been the site of on-going excavations by archeology researchers. Archeological work on the site is close to completion and a design for a museum and park preserving and explain the site is being contemplated. Huge amount of data have been generated during the eight years of the excavation (type of object, location, relationship to other objects) as well as possible connection to the larger archeological record.
We employ a design science research method that generates knowledge and insight of complex problems by the process of design [5]; further, within this knowledge paradigm, multiple designs can serve to uncover an expanded range of possibilities. Our research was conducted by a team of twelve architectural designers and a team of three Hololens developers. This resulted in the design of 12 distinct designs, each of which proposed a specific architectural form and a specific use of Hololens technology.
We evaluated designs using both normative architectural evaluations methods (geometric clarity, circulation, views, lighting and enclosure) as well as interaction evaluation (digital building models and interaction simulation). The programming of the Hololens was conducted in Unity 3D using C# programming language. Each designer created an architectural design that could be tested, changed and refined as the potentials of the Hololens was explored.
In order to better explore and refine the creations of our team of designers. We created an interface for exploration of their architectural and AR interaction designs. The interface would enable us to import 3D models of buildings and create a walkthrough in the proposed space, as well as to embed the proposed interactions. Our interface allows users to view the space in both perspective and plan view and interact with proposed AR objects and information. It also consists of complimentary views that show a user’s interaction log and finally a view highlighting different AR interactions as a user experiences a proposed intersection of AR and architectural space. Experiments with the interface allowed our team to refine the different affordances to fit best with a designer’s vision and to easily implement the proposed interaction affordances for Microsoft Hololens. A taxonomy was developed from these experiments and became available to all designer
3 FINDINGS
Based on the 12 architectural designs, we developed a taxonomy based on inputs (afforded and interactive) and outputs, (display and physical). Investigations involved the creation of specific architectural paired with the use of AR to deliver supplemental data and perspective. As we proceeded, each designer evolved a set of connections between the architecture interface and AR. We compiled these examples into a taxonomy of possibilities.
Afforded inputs are those that because of physical or cultural factors are understood without need for visual feedback. These include:
- proximity, moving closer to or further from an object in the model was understood without the need for feedback.
- gaze target, the direction of a user’s gaze was immediately apparent to user of the system
- gaze duration, because obvious after a few minutes of use by the Hololens
- the orientation that a user faces is apparent in at least two ways; inside/outside can be understood wherever the architecture makes it obvious; geometric orientation is made obvious when the architectural arrangement is strongly delineated.
Interactive inputs require some visual feedback from the Hololens to make it cognitively present:
- angle of view: head motion can be understood as an input in either the vertical or horizontal direction, but require visual feedback to be understood.
- hand gesture: the standard interface in Hololens of finger or hand gesture require significant feedback to be obvious
- voice: the use of voice recognition can be used to provide rich input to the system; feedback verifies the system is engaged.
The output of the architectural/AR system can assume either display or physical aspects.
- physical computing: the rearrangement of physical objects base on a user’s position
- overview/detail: details can be made to appear to come closer to user and be available for inspection
- transparent/opaque: walls can be selectively closed and opened
- “x ray vision”: one can creates display that appear to allow users to see into other rooms or into the city beyond
- virtual space: can be generated around a user as they move through space, guiding or circumscribing movement
- a heat map can show the locations of classes of objects
- cognitive maps can capture the interest of an individual that later guide a customized tour of the site
- explanatory text can appear at appropriate locations, and can become more detailed as one approaches
- virtual objects can appear in the space to connect other objects from the site or from a larger corpus)
- a direction path can be created to guide users
Our work has used Holoens technology but it applies more broadly to any form of AR. For, if AR aims to create new forms of interactions that engage both technological and social factors, design methods must be able to represent both the architectural setting and information interaction simultaneously. Otherwise it will remain separate from the life of the places it occupies.
[1] Azuma, R. T. A survey of augmented reality. Presence: Teleoperators and virtual environments, 6, 4 (1997), 355-385.
[2] Barfield, W. Fundamentals of wearable computers and augmented reality. CRC Press, 2015.
[3] Bolter, J. D., Engberg, M. and MacIntyre, B. Media studies, mobile augmented reality, and interaction design. interactions, 20, 1 (2013), 36-45.
[4] Dourish, P. Where the action is: the foundations of embodied interaction. MIT press, 2004.
[5] Hevner, A. and Chatterjee, S. Design science research in information systems. Springer, 2010.
VAIRoma- Visual Interface for Spatial/ Temporal analysis of Big Data
Eric Sauda, Wenwen Dou, Isaac Cho, Bill Ribarsky
At UNC Charlotte, the Digital Arts Center in the College of Arts + Architecture, and the Charlotte Visualization Center in the College of Computing and Informatics have created a prototype of a space, time and topic based visual analytics system, VAiRoma, (Visual Analytic interface for Roma) that focuses on the 3,000 year history of Rome in the broadest sense, encompassing the Roman Republic and the Empire, through to the Renaissance and the formation of the modern state with Rome as the seat of the worldwide Catholic Church. This history is placed in the context of external events and civilizations that affected the history of Rome. Our work is unique in the application of interactive visual analytic techniques to the humanities and in its incorporation of geospatial into existing work on temporal and topical data. It is also unique in its ability to take hundreds of thousands of individually rich but collectively unstructured documents and organize them into a coherent narrative that can be explored for new insights and unexpected relationships.
Initially we used Wikipedia as a data source, since we could download all articles (nearly 5 million articles in English). We assembled a subset of 189,000 articles selected based on whether they contained the words “Rome”, “Roma”, or “Roman”. Except for this initial step, there was no further hands-on manipulation of the collection. All subsequent analyses were automated, including topic modeling and entity extraction (extraction of dates and named entities, such as locations). Thus formation of the topics that were interpreted to create a long-timeline narrative was driven solely by the textual patterns in the collection without human guidance. Our topic modeling approach is based on Latent Dirichlet Allocation (LDA), a probabilistic machine learning approach that reveals topics embedded in text collection by generating a distinct, ranked set of keywords for each topic. Each document in the collection is then categorized by its main topics. We have significantly extended LDA by developing a scalable version, a hierarchical topic structure, and methods for revealing changing topic behavior over time.
The Wikipedia collection is comprehensive if not complete. We have found that it gives a good overview of Roman history, but it is not very deep or authoritative. We are now adding a much more scholarly collection. Through an agreement with JSTOR, we have gotten access to the complete database. This contains full text articles from nearly 2,000 scholarly journals, including some that cover a range of hundreds of years. Using the same initial keywords as above, we have selected a corpus of 800,000 articles to which we will apply our topic modeling and entity extraction approaches.
We are seeking scholarly partners both to help support the continued development of this system and to demonstrate its utility in exploring and understanding important and very extensive scholarly archives.
Visual Analytics is the field of analytical reasoning facilitated by interactive visual interfaces. Its important features include the ability to deal with high-dimensional data sets, to present information visually, and to allow users to interact with this information, building knowledge and decision-making capability. Visual analytics’ fundamental premise is that analysis is better undertaken as a symbiosis of the computational power of computers with the pattern and sense-making capacity of human users. It is this premise that guides the VAiRoma project.
How, then, can visual analytics enhance archival research among the humanities? The potential utility of the VAiRoma system is revealed by a use case of on-going scholarly research by our colleague, Professor Jeffrey Balmer.
This research focuses on the interior iconography of Bernini’s Sant’Andrea al Quirinale church in Rome. There are ample primary source materials available on this building. Balmer began his research by examining Bernini’s entire oeuvre, attempting to place Sant’Andrea in that context, or others: Roman churches undertaken in the 1650s; those constructed in the Quirinal district during the 17th century; or perhaps churches dedicated to Saint Andrew, or those commissioned by the Jesuit Order – all within narrow parameters of time and place, to allow for an exhaustive examination of all relevant archival materials.
Such parameters are normative for traditional archival scholarship. There are, however, broader contexts of interest. Sant’Andrea al Quirinale might be studied in the context of a history of the Jesuit Order, the Roman Baroque, or the liturgical and aesthetic priorities of both patrons and designers with onset of the Counter-Reformation. Wider yet, the church might be placed within broader histories of painting, sculpture, architecture or urban design. Traditionally, as the frame of reference grows wider, so too does the scope of work: exhaustive command of a subject is demanded of scholarship. Understandably, such efforts remain the province of those special individuals with either super-human stamina or a rare access to the support (financial and temporal) required of such work. Even then, such works are surveys that adopt a measure of superficiality as a necessary premise. The pitfalls of such attempts are well documented: scholars may establish conclusions based on their necessary reliance on secondary sources, which runs the risk of being biased, flawed, or merely incomplete.
The capacities of the proposed VAiRoma system could track not just a specific history of a single building, but of entire districts in Rome, while preserving Balmer’s direct access to primary sources and to deep, highly relevant (non-summary) secondary sources from across scholarly areas. For example, the Quirinal district witnessed widespread construction throughout the 17th century, driven by the expansion of institutions affiliated with the Church in the wake of the Counter Reformation. The VAiRoma system would not only provide Balmer the means to track construction records for Sant’Andrea, but when and where else specific contractors, plasterers, gilders, or mosaicists were active on other projects. Such minutiae, presently isolated into discrete packets of archival particulars, could, like the tesserae of a mosaic, be arranged and re-arranged at will through the capacities that the VAiRoma system would provide researchers.
VAiRoma has already proved to be a useful tool when employed by non-experts and students, who are a better fit for the initial Wikipedia collection. We have developed a complete VAiRoma interface for use by these groups, as described in the attached paper. The interface has been evaluated in multiple user studies and case studies. For example, a group of students who spent a summer session in Rome studying the piazzas were introduced to VAiRoma on the return. After 15 minutes of preparation, they were able to use VAiRoma to successfully find multiple additional Wikipedia articles (about 4 relevant articles per student) on the piazzas even though they had previously been collecting articles for a paper on Roman piazzas. All the students rated the interface highly for ease of use, understandability, and superiority to standard searches. We have since deployed the interface to other student classes with similar results.
In a case study, we gave a small group of faculty members and graduate students access to VAiRoma and the Wikipedia collection. We asked them to construct a timeline, with references, of the history of ancient Rome, over the period from 500 B.C. to 500 A.D, which encompasses the Roman Republic and Empire. These users had no expertise on the history of ancient Rome; they were not historians. After 15-20 minutes of training, members of the group began exploring for main events using for guidance the automatically generated topics, event peaks in the timeline, and geographic patterns extracted from the locations in the documents. Each participant focused on a 250 year period, though some studied wider time ranges. After a few hours, they had collected altogether about 200 most relevant references describing main events. These main events matched a high level timeline compiled by historians. This result shows how the VAiRoma interface permits one to quickly and effectively filter down from a very large number of initial documents (189,000) to a small number of most relevant ones that one can place in an interrelated knowledge structure. Furthermore, the Rome timeline created went beyond a narrow Roman history. For example, participants established a sub-timeline having to do with the development of the Christian church, especially in the Mediterranean area, and the concurrent development of the Jewish Rabbinical tradition. They even discovered the connection between the Roman Empire and the Indian and Chinese civilizations via trade routes including the overland and sea-borne Silk Road paths. An interesting but unexpected connection was established between the Roman Empire and the Han Dynasty in China (a concurrent empire with similarities to the Roman Empire).
Another important advantage of VAiRoma is that it is now available as a Web service. The interface has been placed on a robust Web server and can be accessed by a range of devices including desktop, laptop, and tablet computers. (Access via smart phones is even possible and has been provided for our other Web service-based tools.) A scalable cloud computing backend infrastructure has also been developed so that the full database of analysis products plus (in the case where we are permitted to share them) full texts of the articles in the collection are available for fast, interactive use.
VALSE- Computer vision tool for large scale occupant evaluation.
Recent advances in computer vision are bringing automated analysis of human motion within reach. We have developed the SENSING Toolkit, a framework for collecting and storing long-term, large-scale human motion. Our framework is designed to use a computer vision system, including a network of cameras installed in large indoor spaces, such as building lobbies or healthcare facilities. The system uses ray-tracing logic to detect and track persons and collect metrically accurate locations of where people have been over time and identify activities that were undertaken while they occupied a location. All of this data is collected while protecting the anonymity of the user, by never recording their actual image.
Data collection is just the start, however. To facilitate analysis over very long timeframes, we have developed an interactive, visual analysis interface called VALSE (Visual Analytics for Large-Scale Ethnography), designed to allow domain experts to query and understand the data. VALSE follows a many-coordinated-views paradigm to present a user with motion summaries such as heat maps, scatter plots, and motion trails, as well as avatar-based, animated reconstructions of activity. These visualizations can be dynamically customized with user-defined time intervals for targeted analysis and replayed using a familiar DVR-style interface. This type of tool can expand the reach of traditional social science analysis. VALSE leverages the ability of human ethnographers to recognize meaningful patterns of behavior with the computational ability to apply these insights for very extended periods of time.
Because this work is particularly well suited to scenarios such as health care, which have a large number of actors and a complex set of actions and intentions, we have begun with the study of various programmatic components of clinic and hospital floor plates. As part of a collaboration with a national architectural design firm, this project creates a tangible analysis of the organizational systems
implemented in these complex and highly orchestrated design problems. Rather than rely on a short-term analysis by an ethnographer or partial semantic data from occupants which is often multiplied out to create averages, VALSE creates a comprehensive analysis of the actual use and performance of each floor or clinic, with real analytics over much longer time periods. There are two specific outcomes of this research. First, it allows for a fine-grained understanding of the uses that are made of facilities, which could, in turn, lead to improved future design. And second, the analysis of the human use of the architectural setting can potentially become a part of the therapeutic setting, allowing adjustments to individual patient’s therapy.