PAPER[space] Architecture: A tool kit for Speculative Digital Drawing
By Andrew Beres, Chris Beorkrem, and Jefferson Ellinger
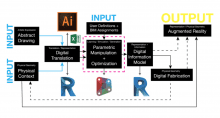
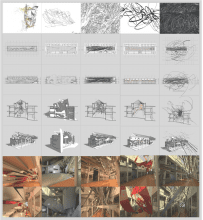
This project aims to develop a parametric process for the realization of diagrammatic architectural space derived from abstract drawing through a series of parametric operations that interpret both a drawing and a proposed context within which the drawing is sited. As observed in Figure 1, a workflow is postulated from conceptual drawing to digital information model, with the potential for conceptual realization through virtual/ augmented reality or digital fabrication.
The process of interpretation begins with the computational interpretation of the abstract drawing by creating a high-resolution scan, which is then brought into Adobe Illustrator or Adobe Capture. By running the live-trace function, scalable vectors are generated from the raster scan. The vector drawing is then exported for operation within a digital modeling environment. The vectors are imported into the Autodesk Revit environment for interpolation and manipulation using Dynamo, the built-in visual scripting interface for Revit.
By referencing the line work, the process of interpretation starts with a series of operational tests to derive strategic groupings of curves within a drawing based on their inherent hierarchy and logic. The first test is to determine whether each instance of information within the drawing is either a point, a curve, or a plane. Within the script, a point is defined as a curve object with a single control point, while a curve is defined as an open network of control points and inversely a plane is defined as a closed network of control points. To test for open vs. closed, an operation determines the start point and end point of a curve and tests their location (x, y, and z) for coincidence as described in figure 3. The operation also tests for rectangularity by measuring the distance along the curve from control points, a rectangle consists of four control points, while a square has four control points that have congruent edge curves.
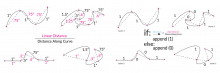
The next operation is to determine a specific curve type. This test categorizes curves into 4 groups, the Jitter, Jump, Wiggle, and Swipe. The jitter is defined as local groupings of control points that occur at relatively equal distances along the curve. The Jump is defined as a single cluster of control points located on the curve. The wiggle is defined as an even distribution of control points across the curve. The Swipe is defined as a minimal number of control points across the curve, often resulting in a gentle curvature. This algorithm also tests for local and global proximity in line type. By testing each curve’s ‘score’ against other line scores within a user defined radius and across the entire drawing, patterns of lines emerge as another grouping method.
The third operation tests for line curvature ratios, resulting in a total line score factor. This test measures both the linear distance from one control point to the next, and tests it against the distance along the curve from control point-to-control point. The total line score is generated based on a user input factor for the minute control of grouping with a slider. The rule for testing the curvature factor against the line score is displayed in figure 4.
The final operation test examines each curve’s relative average tangency. By determining the curve’s normal vector at the midpoints between control points, the script generates a general direction based on the sum of the vectors (figure 5). This is then used as an additional layer of information in the categorization of the linework in the drawing.
The second input in the logic diagram (figure 1) is the desired context for the drawing. This is generated by digitizing a real environment using laser scanning or aerial photogrammetics, or working within an existing digital information model. Using the context as a reference, the input drawing is then repositioned and scaled to the bounding box of one of the faces as defined by the user, a vertical face will treat the drawing as a section, while a horizontal face will treat the drawing as a plan. The repositioned drawing is warped to match the profile of the face by remapping the control point coordinates to the limits of the context face using a regular grid system (figure 6).
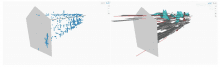
The lines are then extrapolated through the contextual form based on a preset understanding of the group types within the drawing. The generated form is displayed within the Dynamo graph as a conceptual abstraction (figure 7). The model allows for the local adjustment of the geometry given the designer’s preference once they have had the opportunity to understand it as a three-dimensional space.
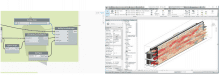
From the conceptual representation of the extrapolated drawing, the designer then can make type based associations for the forms generated in space. This type-setting of BIM objects based on the line work aligns this tool with DeLanda’s postulation regarding virtual modeling in architecture, by assigning the properties of a wall, floor, light fixture or structural column to a digital object, the model takes on the inherent properties of those materials within an alternate reality. The forms are translated into BIM objects within the Revit environment as seen in figure 8. The model can then be documented using tradition two-dimensional techniques such as plan, section, or elevation but can also be used to generate perspective renderings of the model’s virtual reality. Using a method for translating Revit models into the gaming engine Unity, the model can be experienced using augmented reality technology such as Microsoft HoloLens to give designers the ability to occupy the space within their drawings, offering designers the ability to perceive new spatial possibilities within the minutia of their sketches. Other means for the realization of the abstract forms generated include digital fabrication with advanced manufacturing tools or small scale prototyping with 3d printers.