Urban Activity Explorer, a Visual analytic interface for Social Media
Data and Design: Using Knowledge Generation/Visual Analytic Paradigms to Understand Mobile Social Media in Urban Design
As smart phones have become part of everyday life, communication technology and its role in shaping cities and social life became an essential topical area in architecture and urban design. The enormous volume of data being generated (estimated to reach 438 billion messages per day in 2019) [Ericcson 2016, Arce 2015] now provides new information about the social realities of cities. This development has expanded research and teaching the areas of visual analytics, urban modeling, and communication studies [Chang 2007, Offenhuber 2014, Waddel 2002], which have become important resources in environmental design disciplines. Our work expands upon this discourse, addressing the intersection of the built environment and virtual communication.
Mobile social media (Twitter, Four Square, Instagram, etc. with mobile devices such as tablets and smart phones) plays a particular role in our research as it combines many important geospatial, temporal and semantic elements as a data source. These elements have been considered important in conducting geospatial analysis [Andrienko 2010]. Twitter’s online social networking service is particularly interesting both for its widespread use and the API (Application Programmer Interface) that allows access to data for software development and research purposes [gnip 2016]. Twitter is also well studied (for a ten year old service) and has been used toward understanding a variety of urban scale phenomenon from locations of traffic accidents or other emergencies and unplanned events such as Tahrir Square, to understanding spatial movement of food trucks [MacEachren 2011, Tufekci 2012, Wessel 2015]. We recognize the limits of Twitter data; it can be demographically skewed toward the younger and the wealthier, and it is only reliable in large, aggregated data sets. Our results are subject to verification by other sources, but the methods would remain applicable.
Our interest in mobile social media investigates the relationship between the flow of information generated by mobile social media and the urban form of the city. One extreme position suggests information and communication technologies (ICT) have rendered location meaningless; such a position was taken by Melvin Webber [Webber 1964] as early as the 1960’s based on his analysis of the extreme sprawl of American cities such as Los Angeles. At the other extreme are theorists who believe that the essential character of cities has remained more or less unchanged; new urbanism [Leccese 2000] is the latest such belief in the “timelessness” of urban form.
We have tried to make both positions sound credible, but both the rearguard and the avant-garde ignore current urban conditions in favor of longing for the past or promoting a bright future of uncertain prospect. Our effort is focused on finding specific on-going evidence of ICT as an indicator of the spatial form in the city, and conversely how the form of the city influences the uses of ICT. Mobile social media data is an ideal empirical source for such an analysis, combining spatial, temporal and topical information and providing large data sets for analysis. It is important (and difficult) because it is unstructured data, mostly unfiltered by existing categorization.
In this paper, we present three models of how to approach the analysis and use of Twitter data. The first two began as focused attempts to accumulate and explore large-scale Twitter data. The third is a model that incorporates lessons learned from the first two models into a novel visual analytic interface. Our research team includes professors, researchers and advanced students from architecture, urban design, computer science and visualization.
First Approach: Problem Formation and Selective Data Acquisition
We began by collecting data using the Twitter API, which allows anyone to collect tweets by incorporating a number of delimiting variables such as time, location, hashtag, etc. Using this method, approximately 10,000 tweets were collected. We formulated specific problems with an important spatial component that Twitter data might help us to understand, gathering information that was either geographically limited or constrained by a keyword. This avoided a potential flaw with Twitter data; only about 2% was geo-tagged by the user. The use of a tightly defined search captures a selection of all users in that area.
Two examples will illustrate this approach.
We guessed that the spatial and temporal pattern of tweets during travel might vary from everyday patterns. Based on the collection of geolocated tweets at an international airport over a two-week period, we were able to generate heat maps of the tweet locations within the airport. This was a fairly predictable pattern highlighting the concourses, where people have free time as they wait, in addition to last minute or just arriving tweets on the taxiway.
We were then able to identify individual users (without breaching their privacy) and their tweet history of a two- week period centered on their tweets at the airport. We generated a graph that compared the frequency of their tweets in the airport versus the frequency of their tweets on the days before and after the airport sample. We found a clear pattern of accelerated tweets during their time at the airport, shown in the radial graph by the large size of the red graph area (Figure 1).
A second example project studied tweet activity associated with the work of Banksy, an artist who creates artwork in public places with no prior warning. His work has a devoted following, and a great deal of excitement attends with possibility of his new artwork emerging.
To gather information about Banksy, we again used the Twitter public API, limiting the search to geolocated tweets that use the keyword Banksy. We were able to gather a large number of tweets and study the blooming of tweets volume following the arrival of the new artwork and the spread of the tweets around Bristol and across England.
Using visualization, we were able understand how a spontaneous event has not just a time signature (which has been extensively studied) but also a pattern of spatial diffusion from Bristol outward (largely toward London) (Figure 2).
Based on our work, we identified both strengths and weaknesses to this problem formulation approach. It allowed us to focus our inquiry and deal with the limits of the public API (limits to the number of tweets we can receive by a query and the number of times we can query the Twitter database). At the same time, the specificity of our search forestalled any wider exploration of large data sets without a heavy load of assumption.
Second Approach: Large Scale Data and Selective Query
In the spring of 2016, we joined a campus-wide Data Science Initiative, which afforded us access to large archives of Twitter data not accessible from the public API. We acquired a collection of about 2 million tweets of New York City and an equal number of Los Angeles metropolitan area over a two-month period. Unlike our previous use of the Twitter public API which used specific keywords to search, we used a large geographic boundary to get access to a comprehensive set of geolocated tweets for those two cities. Our datasets consisted of only the tweets that originated from the specified geographic boundaries. Our goal was to create a permanent archive that we could use for the study of a variety of issues.
Our aim was to introduce data visualization and analytics to analyze social media data for the purposes of urban studies. One research group focused on the locations of the tweet data relative to morphological and spatial characteristics of the city and the other focused on social characteristics of using the locational, temporal and topical dimensions of the data.
For each group, we used the Twitter data in combination with a variety of data analysis methods such as Python programming for data wrangling and analysis, Geographic Information Systems (GIS) for mapping and spatial analysis of the data, MongoDB database for accessing and querying the data.
The urban form and information study investigated the distribution of geolocated tweets and their relationship to other normative factors in urban analysis. The goal of this group was to study and analyze elements of urban form and policy and their relationship with tweet data; for example focusing on the analysis of transit oriented development (TOD) areas in Los Angeles or the connectivity of streets.
We started by creating a map of the locations of each tweet (1,000,000 total) in Los Angeles County and New York City. We then proceeded to develop a map that represented a cumulative tweet count for each census track within the county, with a single dot sized to represent the total count for each track. Next, we overlaid the census tract tweet count index with population, age and ethnicity data derived from American Community Survey 2014 [Bureau 2016]:
In addition to the visual evidence provided by these overlaid maps, we also used linear regression analysis to find relationships between different variables. The results of this analysis showed no significant correlation between any of the factors obtained from the U.S. Census. The results of these regression analyses showed us that the locations of geolocated tweets were not directly and linearly affected by population demographic information.
We suspected that land use might be a more important predictor of tweet location than demographic data. We derived land use and zoning data from each city’s respective planning governments [Planning 2016] and mapped the tweet data against different land use types (Figure 3):
- Residential density
- Institutional density
- Mixed use zoning
- Parks and open space
- Commercial development We performed a regression analysis on these findings to determine the correlation between these factors. The only clear correlation was between commercial development and tweet density. We were also interested in the relationship between mass transit and tweet density. We located each Metro station in Los Angeles and every subway station in lower Manhattan, measuring the tweet density at each within a one- mile radius. We discovered influence on tweet activity but it was not decisive. We also calculated tweet density for 1 mile, .5 mile and .25 mile radius from each station to try to test the influence of the station on the tweet activity. We found both a general rise in tweet activity surrounding stations and a significant number of anomalies. Finally, we were interested in analyzing and visualizing the movement of Twitter users. Our first attempt connected the locations of every user who tweeted more than two times as a straight line. However, due to the nature and scale of the dataset, this type of visualization created an unusable spaghetti like map identified by other researchers [von landesberger 2016]. To solve the issue, we developed a unique method that identified Twitter users with multiple tweets over a day and plotted their locations onto the street map using Dijkstra’s shortest path algorithm [Dijstra 1959]. To calculate the shortest path we used ArcGIS Network Analyst [esri 2016]. We collected the street data from OpenStreetMaps [OpenStreetMaps 2016] and processed our network files with GISF2E [Karduni 2016] to develop a representation of the use of the street system. We found considerable asymmetry of the Twitter users on the street grid using on the already identified location of commercial activity. The urban form and society study tackled a much more complex problem. They studied how urban space is related to social factors, including both the identification of preferred locations for groups of tweets and sub groups. This group began with an analysis of the demographic factors including population density, race, language, age, income and gender. Each of these factors were analyzed using ordinary least square regressions and displayed in a scatter plot matrix. No significant correlation was found between any of these factors and the location of tweets. We next turned our attention to a comparison of English and Spanish language tweets. We compared the distribution of geolocated tweets with Hispanic information from the U.S. Census. We also studied the distribution of English and Spanish language tweets over the period of a month, identifying the top five spikes by location in each language. Seeking to discover the relationship between events and tweet data, we identified major events from archives of the Los Angeles Times newspaper for a one-month period. For each event, we identified the volume of tweets and plotted geolocation information. Using the Dijkstra’s shortest path algorithm mentioned above, we constructed tweet trails for all English and Spanish language tweets. We were then able to compare the similarities and differences of movement between the two groups (Figure 4). We were then able to construct heat maps highlighting the concentration of each group’s movement that showed areas where different groups of people tweeting in different languages were frequently traveling. While our studies yielded interesting insights into the use of social media, the amount of special knowledge and the effort entailed by this approach limited its general adoption and the ability to use it in design settings for rapid feedback and scenario testing. Third Approach: Interactive Visual Analytics and Large Data Sets Based on the limits that we identified using selective queries, we partnered with a visualization group on campus to design a visual analytic interface using New York City and Los Angeles data sets.
Visual analytics is the emerging field of analytical reasoning facilitated by interactive visual interfaces. The field’s important features include the ability to deal with high-dimensional data sets, to present information visually, and to allow researchers to interact with this information. Visual analytics’ fundamental premise is that analysis is better undertaken as a symbiosis of the computational power of computers with the pattern and sense-making capacity of human users [Ribarsky 1994, Chen 2009].
In this phase, we created Urban Activity Explorer, a new visual analytic interface, initially using the 2 million tweets we have collected in Los Angeles County as a sample data set.
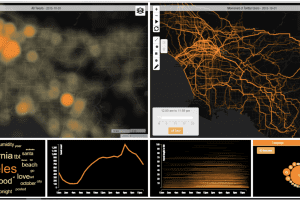
A central and unique feature of Urban Activity Explorer is the map views that afford interactive exploration of the geolocations of the tweet data set. One view includes a heat map showing the intensity of tweets that allows the identification of clusters of activity. A second view includes a flow map, which identifies the paths of all individuals in the data set that have multiple tweets for a single day. Built upon the results of our second approach, we mapped these multiple locations onto the street grid, which provided a view that in the aggregate represents the flow of tweets mapped onto the urban infrastructure. The power of visual analytic interfaces is largely derived from the connection between data representation. In our case, we connect the map views to two forms of topic representation and two forms of timelines.
One topic view includes a simple word cloud (a count of the frequency of the occurrence of a word within a body of text). This view provides a quick overview of topical concerns, especially as the size of the text archive is smaller. The other view includes a topic model in Latent Dirichet Allocation (LDA) [Hoffman 2010] that uses a more complex analysis of the distribution of connections between terms. LDA is more useful with large archives, especially when they may have more complex information.
The first timeline illustrates a simple graph of occurrences of any selected item over time. The user can select any time period to investigate peaks and valleys of tweets. The second timeline accompanies the flow analysis and allows users to simultaneously select both a time interval and a limit for travel distances.
Interaction is a key aspect of our interface that was designed to allow for free investigation of a very large data set, rather than providing answers to one specific question. This allows a diverse range of users to investigate the data the without knowing ahead of time what factors might be important or what they might find. This ability to generate insight and knowledge-building is a key aspect of visual analytic interfaces [Chang 2009].
Figure 4. Urban Activity Explorer, a visual analytic interface showing Los Angeles County. Heat map of tweets location (top left), flow map (top right), word cloud, timelines and language/topic views (bottom).
FUTURE WORK AND CONCLUSIONS
We expect that the next research initiatives within our group will include the explicit incorporation of knowledge generation and user testing our interface with urban design.
Insight and knowledge are key aspects of visual analytic systems. We plan to incorporate the knowledge generation paradigm research of Daniel Keim into our work with Urban Activity Explorer, but more generally we propose such systems as a particularly useful and appropriate approach for design. Keim articulates three levels of reasoning that form a framework for human computation. An important feature of these “loops” is that they represent not steps in a linear sequence, but rather three activity loops with distinct goals and processes that are engaged iteratively. The exploration loop is the exploration of a large data set to test preliminary ideas about the organization of the data. The verification loop is the creation of a hypothesis that is testable within the world of the visual analytic system. The knowledge generation loop tests and extends the interpretative power of a hypothesis.
Once we have completed the incorporation of this knowledge generation approach, we will conduct user tests of urban designers using the framework proposed by Schön [Schön, 1983], which we understand broadly as the proposal of alternatives and an ability to use sensemaking for framing and evaluation. Such a process requires several features that our approach affords to users.
First, any system that will be useful for urban design must be able to provide quick feedback; the quicker the better. This is particularly important for the evaluation process, as probing the design space of solutions is most effective if it can move quickly through widely spaced alternatives. Our approach has moved toward rapid, speculative interrogation of data sets, enabling this quick access and evaluation of alternatives.
Second, a system should allow the discovery of knowledge built up from an iterative search. Visual analytics allows us to “…analyze huge information spaces in order to support complex decision making and data exploration. Humans play a central role in generating knowledge from the snippets of evidence…” [Sacha 2014]. Our approach integrates evidence emerging from the exploration of large data sets with the knowledge and insight of urban designers.
Our interface offers two primary means of accomplishing these objectives. First, it provides a valuable tool to teach principles and techniques of information visualization about cities that are both qualitative (tweet topics) and quantitative (temporal information and counts). Second, the interface allows users to generate new interpretations and insights about cities and human activity that were previously indiscernible with traditional mapping techniques or unilateral data. Therefore, the interface will be used as a methodological tool to develop multi-faceted knowledge in the emerging domain of digital urbanism.
The goal of our research is to discover and invent methods to understand the transformational impact of information and communication technologies. We focus on mobile social media, specifically Twitter, because of its combination of temporal, spatial and topical information.
Over three years in our research group, we began with spatially constrained, modestly sized data sets, progressed to large scale data sets combined with custom scripted queries and finally to the design of a visual analytic interface that will be used as a framework for urban design.
The integration of Urban Activity Explorer, a sophisticated, large-scale visual analytic system into the design process is a novel approach within the fields of architecture and urban design. It provides unique opportunities to leverage our domain knowledge in a way that avoids simplistic solutions, instead incorporating the exploration of innovative approaches using empirical methods. Based on our studies, we have concluded that visual analytic interfaces that create a mixed human computer settings are best suited to unstructured data (such as social media data), design settings and indeed, in open exploration of any data without predetermined and limited objective functions.
Early versions of Urban Activity Explorer were designed using needs surveys and user studies of urban designers. We have now incorporated the knowledge generation paradigm into our ongoing studies with urban designers; this requires refining both the computer interface and the expectations and setting for the users. Our approach has proven to be consistent with the needs of designers for exploration of design alternatives and multiple scenarios; indeed it is in many ways remarkably similar to traditional design methodology, albeit applied to very large data sets. Data is essentially no different than other design factors; it requires interactive engagement and exploration.
REFERENCES
Andrienko, G., et al., Space, time and visual analytics. International Journal of Geographical Information Science, 2010. 24(10): p. 1577-1600. Arce, N. 438 Billion: Daily Volume Of Mobile And Online Messages By 2019. TechTimes 2015; Available from: http://www.techtimes.com/articles/67352/20150709/438-billion-daily-volume-of-mobile-and-online-messages-by- 2019.htm.Bureau, U.S.C., Data Releases. 2016.
Chang, R., et al.,Defining insight for visual analytics. IEEE Computer Graphics and Applications, 2009. 29(2): p. 14-
Chang, R., et al.,Legible cities: Focus-dependent multi-resolution visualization of urban relationships. IEEE transactions on visualization and computer graphics, 2007. 13(6): p. 1169-1175.
Chen, M., et al.,Data, information, and knowledge in visualization. IEEE Computer Graphics and Applications, 2009. 29(1): p. 12-19. Dijkstra, E.W., A note on two problems in connexion with graphs. Numerische mathematik, 1959. 1(1): p. 269-271.
Erricson, Ericsson Mobility Report. 2016. esri.com. Route analysis. 2016; Available from: http://desktop.arcgis.com/en/arcmap/latest/extensions/network- analyst/route.htm. gnip. Gnip -About. 2016; Available from: https://gnip.com/about/.
Hoffman, M., F.R. Bach, and D.M. Blei.Online learning for latent dirichlet allocation. in advances in neural information processing systems. 2010.
Karduni, A., A. Kermanshah, and S. Derrible,A protocol to convert spatial polyline data to network formats and applications to world urban road networks. Scientific data, 2016. 3.
Leccese, M. and K. McCormick,Charter of the new urbanism. 2000: McGraw-Hill Professional. MacEachren, A.M., et al. Senseplace2: Geotwitter analytics support for situational awareness.in Visual Analytics Science and Technology (VAST), 2011 IEEE Conference on. 2011. IEEE. Offenhuber, D. and C. Ratti, Decoding the city: Urbanism in the age of big data. 2014: Birkhäuser. OpenStreetMaps. About OpenStreetMaps. 2016; Available from: https://www.openstreetmap.org/about. Planning, D.o.R., Maps & GIS | DRP. 2016.
Ribarsky, W. and J.D. Foley,Next-generation data visualization tools. 1994. Sacha, D., et al., Knowledge generation model for visual analytics. IEEE transactions on visualization and computer graphics, 2014. 20(12): p. 1604-1613. Schön, D.A., The reflective practitioner: How professionals think in action. Vol. 5126. 1983: Basic books.
Tufekci, Z. and C. Wilson,Social media and the decision to participate in political protest: Observations from Tahrir Square. Journal of Communication, 2012. 62(2): p. 363-379.
von Landesberger, T., et al.,Mobilitygraphs: Visual analysis of mass mobility dynamics via spatio-temporal graphs and clustering. IEEE transactions on visualization and computer graphics, 2016. 22(1): p. 11-20.
Waddell, P.,UrbanSim: Modeling urban development for land use, transportation, and environmental planning. Journal of the American Planning Association, 2002. 68(3): p. 297-314. Webber, M.M., The urban place and the nonplace urban realm. 1964. Wessel, G., C. Ziemkiewicz, and E. Sauda, Revaluating urban space through tweets: An analysis of Twitter-based mobile food vendors and online communication. New Media & Society, 2015: p. 1461444814567987.